
Unlocking the Power of Data Patterns to Drive Business Decisions


Data does more than record what happened in a business. It reveals patterns that can guide smarter decisions. Imagine a company sees sales spike every Friday. The numbers show the fact, but the real insight comes from asking why this happens and what to do next.
This post explores how identifying patterns in data leads to better business actions. It explains how to move beyond dashboards and use data to improve marketing, inventory, staffing, and customer targeting.
Understanding What Data Shows and What It Hides
Raw data tells you what happened. For example, sales reports might show a steady increase on Fridays. But data alone doesn’t explain why. That requires digging deeper.
A data analyst asks questions such as:
Is website traffic higher on Fridays?
Are customers responding to a weekly promotion?
Is a specific product driving the sales increase?
Are certain customer groups buying more?
Does this pattern repeat every month?
These questions help uncover the underlying causes behind the numbers. Without this step, businesses risk making decisions based on incomplete information.
Finding Patterns in Everyday Business Data
Patterns often hide in plain sight within daily data. Here are some common examples:
Weekly sales cycles: Some businesses see higher sales on specific days, like Fridays or weekends.
Seasonal trends: Sales may rise during holidays or certain months.
Customer behavior: Certain groups might buy more frequently or prefer specific products.
Product performance: Some items consistently outperform others in sales or profit.
Identifying these patterns requires consistent data collection and analysis. Tools like spreadsheets, business intelligence software, or Power BI can help visualize trends and spot anomalies.
Why Understanding Patterns Matters
Recognizing a pattern is just the start. The real value lies in understanding why it happens and what to do with that knowledge. This leads to better decisions that improve business outcomes.
For example, if sales rise every Friday because of a weekly promotion, the company might:
Increase marketing efforts on Thursdays to boost Friday traffic.
Stock more inventory of popular products before Friday.
Adjust staffing levels to handle higher customer volume.
Target specific customer groups with personalized offers.
Without understanding the cause, businesses might miss these opportunities or waste resources on ineffective actions.
Turning Patterns into Actionable Decisions
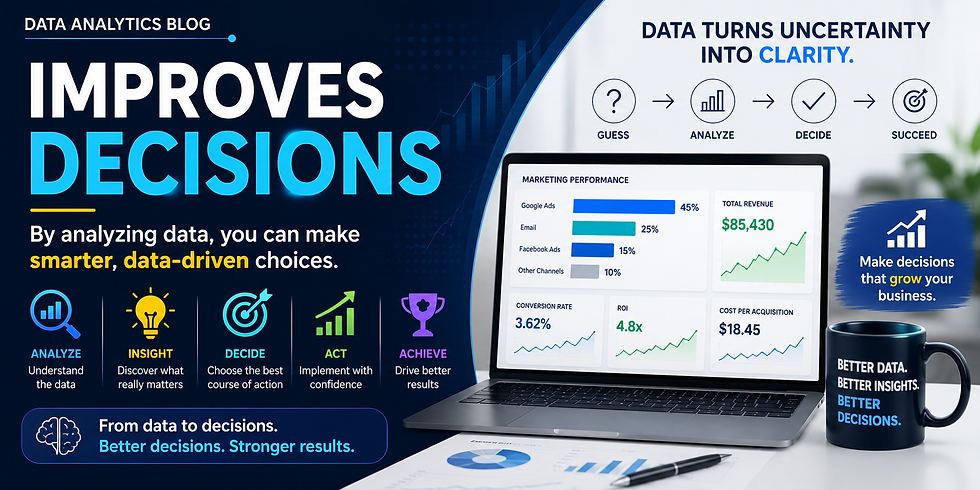
Here are practical steps to use data patterns for business improvement:
Collect reliable data: Ensure sales, website traffic, customer info, and promotions are tracked accurately.
Analyze regularly: Review data weekly or monthly to spot emerging trends.
Ask why: Investigate the reasons behind patterns by combining data sources and customer feedback.
Test hypotheses: Run small experiments, like changing promotion timing or inventory levels, to see what works.
Adjust strategies: Use insights to refine marketing, inventory, staffing, and customer targeting.
Monitor results: Track changes to confirm improvements and identify new patterns.
This cycle helps businesses stay responsive and make data-driven decisions that boost performance.
Real-World Example: Retail Sales on Fridays
A retail company noticed sales jumped every Friday. The data analyst dug deeper and found:
Website visits increased by 30% on Fridays.
A weekly email promotion sent on Thursday evening drove traffic.
A particular product category sold 50% more on Fridays.
Customers aged 25-34 were the main buyers.
Using this insight, the company:
Increased inventory of the popular product before Friday.
Scheduled more staff on Fridays to improve customer service.
Enhanced the email promotion with personalized offers for the 25-34 age group.
Launched social media ads targeting that demographic on Thursdays.
As a result, Friday sales grew by 15% over the next quarter, and customer satisfaction improved.
Avoiding Common Pitfalls
When working with data patterns, watch out for these mistakes:
Assuming correlation means causation: Just because two things happen together doesn’t mean one causes the other.
Ignoring external factors: Events like holidays, weather, or competitor actions can affect patterns.
Overlooking data quality: Inaccurate or incomplete data leads to wrong conclusions.
Failing to act: Identifying patterns without following through wastes potential benefits.
Staying critical and thorough ensures data analysis leads to meaningful business improvements.
Conclusion
Data reveals more than past events. It uncovers patterns that explain why things happen and guide what to do next. Businesses that use data to understand these patterns can improve marketing, inventory, staffing, and customer targeting.
Start by asking questions beyond the numbers. Look for consistent trends, test ideas, and adjust strategies based on real insights. This approach turns data from a record-keeper into a powerful decision-making tool.
Unlock the power of data patterns to make smarter, more effective business decisions today.


Comments